
MiPower® is powered by a robust and comprehensive power system analysis toolbox, covering all major aspects of Power System studies — from steady-state analysis to stability, security assessment, reliability, and protection.
Designed to meet the needs of power system planners and operations engineers, MiPower operates on a Windows-based platform, offering a highly interactive and user-friendly interface.
Its professionally crafted graphical user interface (GUI) and centralized database architecture enhance both usability and performance, making it an efficient tool for modern power system analysis.
- Intuitive icons for all power system elements.
- Multi-layer supports to easily view, select, edit, and present simulation results.
- Customizable bus base voltage levels and colour coding for system elements.
- Dedicated property window for each power system element.
- Edit the network and database either together or separately.
- ON/OFF switching control for all power system elements.
- Export single-line diagrams (SLDs) to formats like AutoCAD, PDF, BMP, GIF, JPEG, PNG, and TIFF.
- Compliant with widely accepted IEEE/ANSI standards.
- View, print, or plot full or partial single-line diagrams (SLDs) showing only system topology, or with load flow results, fault study results, and other analysis outputs.
- Advanced tools like layering, panning, zooming, and scaling to any paper size (A5 to A0). Options to print full diagram, selected area, or current view; supports copy and paste.
- GPS interface integration.
- Protection simulation: trace relay operations forward or backward; first operating relay blinks for clarity.
- Dynamic simulation for “what-if” analysis without changing the central database.
- Generate multiple PDFs by selecting Numerous GUI files linked to the same database.
- Batch execution support for Load Flow Analysis (LFA), Transient Stability (TRS), and System Protection.
- Optimal capacitor placement functionality.
- Switching optimization feature to improve system performance.
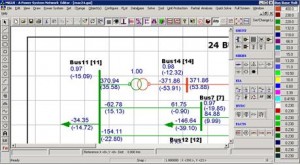
- Interactive forms for quick and detailed data entry.
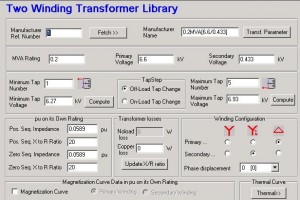
- Equipment data is segregated into Element Data and Library Data, reducing repetitive entries for power system elements with identical parameters.
- Users can define any number of contingencies and schedules as needed.
- Standard libraries available for nearly all power system components, including relays.
- Once the database is accurately built, a wide range of power system studies can be performed.
- Easy toggling between Database Manager, Network Editor, and Graphical Views for smoother navigation.
- Flexible Analysis Execution.
- Run simulations in multiple ways:
- Directly from the Power System Network Editor.
- While entering data interactively via the Database Manager.
- Through ASCII input or batch files for automated execution.
- Run simulations in multiple ways:
- Supported Power System Studies.
- Load Flow Analysis.
- Short Circuit Studies.
- Transient Stability Analysis.
- Overcurrent Relay Coordination.
- Distance Relay Coordination.
- Voltage Instability Analysis.
- Dynamic Stability.
- Three-Phase Load Flow.
- Time-Series Load Flow.
- System Protection.
- Open Access Feasibility.
- Sub-Synchronous Resonance.
- Harmonic Analysis.
- Network Reduction.
- Electromagnetic Transient Analysis
- Distribution Reliability Indices.
- Generation Scheduling.
- Observability Indices.
- State Estimation.
- Arc Flash Analysis.
Reporting & Standards
- Generate reports in standard formats, including IEEE-compliant formats.
- Import standard IEEE datasets directly into the software.
- In-built data validation for power system elements.
Advanced Data Management
- Perform batch analysis using input files.
- Convert Bus-Breaker into Branch with ease.
- Use Global Update features to quickly apply changes across multiple data points, such as:
- Distance Relay.
- Import or export relay settings from/to contour.
- Export settings to Excel or text files.
- Update adjacent elements.
- Modify TRS characteristics.
- Phase Backup Relay.
- Update adjacent elements
- Modify TRS characteristics
- LOE Relay.
- Modify TRS characteristics.
- Out-of-Step Relay.
- Modify TRS characteristics.
- Transmission Line.
- Update circuit ID
- Distance Relay.
- Plot multiple X and Y columns.
- Customize curve color, thickness, symbols, title, and font.
- Export graphs to DXF, CFG, or text formats.
- Run Harmonic Analysis on graphs.
- Perform basic math operations on graph data.
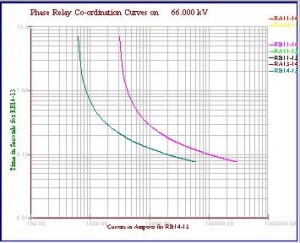
- Move relay curves and edit curve details.
- Change base voltage of plotted graphs.
- Overlay another curve on the existing graph to compare results with reference curves.
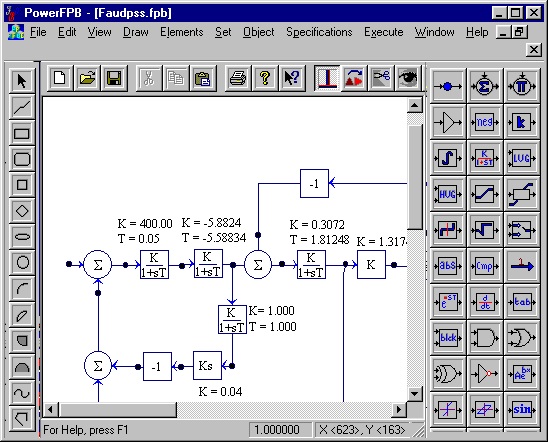
- Built for Simulation and Testing of control Blocks.
- Supports 50+ types of nodes and 30+ elementary block types.
- Built-in support for 5 standard disturbances to test response of block diagram.
- Design custom Governors, AVRs, SVCs, HVDC, FACTS, and STATCOM controllers.
- Link control blocks with Transient Stability to evaluate system performance.
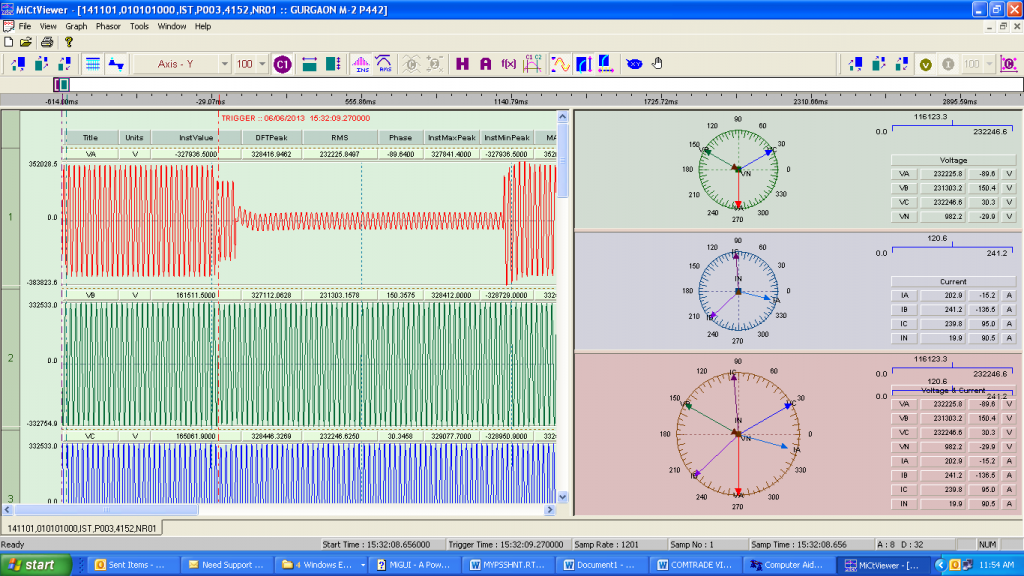
- View both analog and digital channels
- Display phasor views for voltage and current channels.
- Export analog channel data in multiple formats: Instantaneous, RMS, Sequence, Power, Angular difference, Harmonics, and R-X plot.
- Calculate and display harmonics in a bar chart.
- Build custom curves with a computational view.
- Merge and edit two COMTRADE files from disturbance recorders; remove unwanted channels and create new files for further analysis.
- Generate reports that include:
- File information
- Summary of analog channels
- Digital channel data
- Sequence events from digital channels
- Images of analog, digital, and phasor data
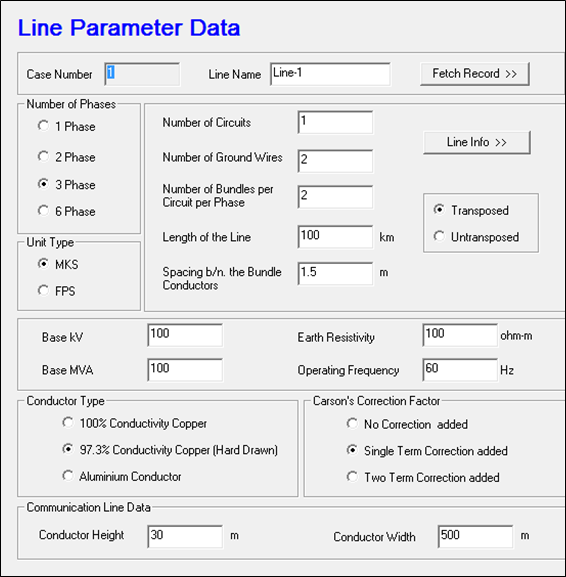
- Supports up to 6 circuits for 3-phase lines and 3 circuits for 6-phase lines.
- Calculates DC line parameters.
- Parameters can be derived for both transposed and un-transposed lines.
- Supports MKS and FPS unit systems.
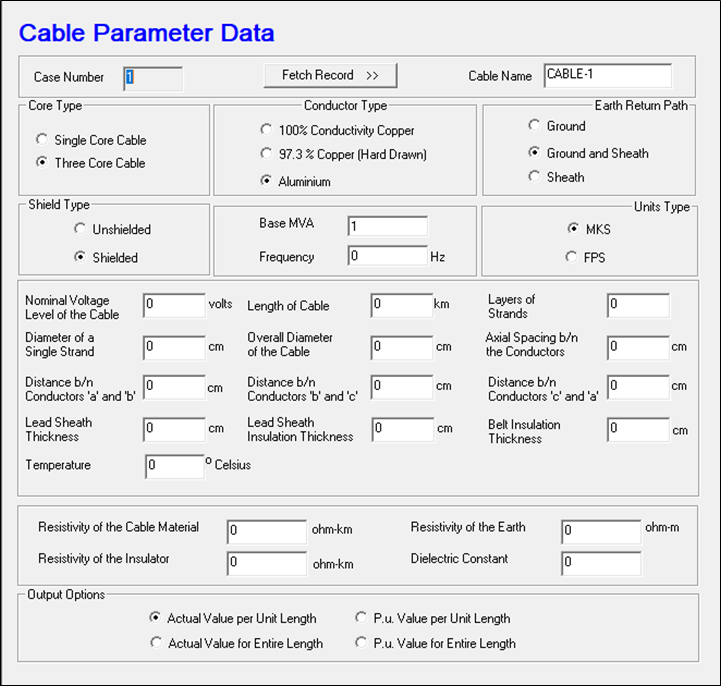
- Computes cable parameters for single-core and three-core cables.
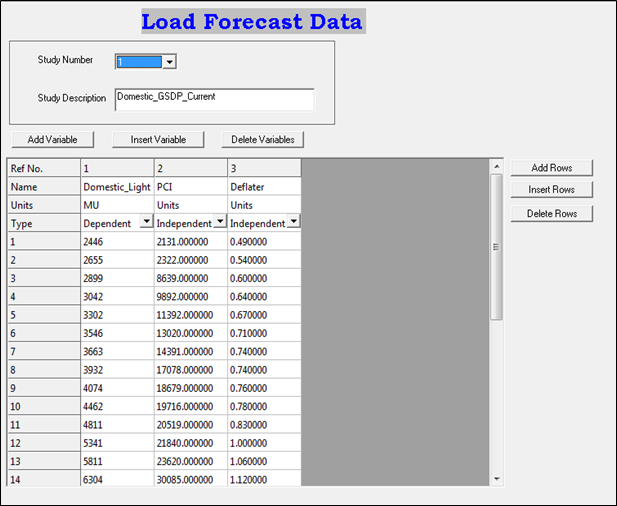
- Supports up to 18 independent variables (e.g., population, income, number of consumers).
- Allows up to 18 dependent variables (e.g., energy use in domestic, commercial, and agricultural sectors).
- Automatically selects the best model.
- Generates detailed reports and graph outputs.
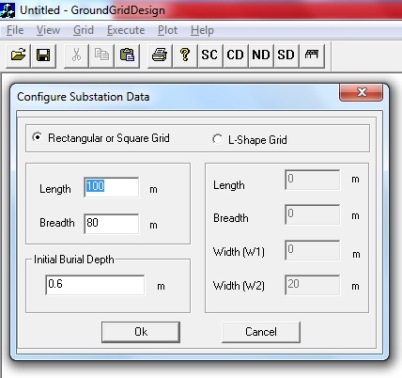
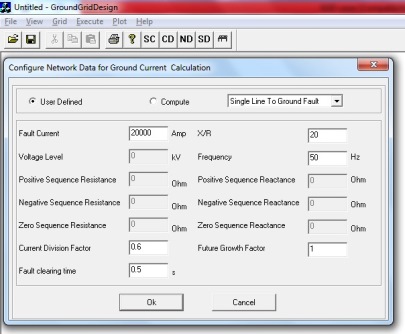
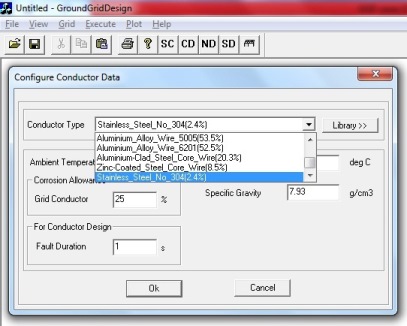
Ground Grid Design has been specially developed in compliance with IEEE 80-1986/2000 , IEC TS 60479 and IS 3043-1986, for utility & industry to arrive at an economic & safe design of new grounding grids as also for checking adequacy of existing grids. User-friendly data entry and graphical 2-D plotting make G-GRID software an efficient tool that helps in analyzing earth potentials and enables engineers to choose a technically sound and economical design of grounding grid from a variety of options.
Salient features :
- Design of HV & EHV sub stations.
- Checking adequacy of existing/designed grounding systems
- Provision for both uniform and non-uniform (two Layer : derived from field measurements) soil models
- Calculation of ground potential rise (GPR) , tolerable shock currents based on IEEE or IEC Standards , depth of burial , step – touch – transferred potentials, bill of quantity(BOQ), costing, etc…
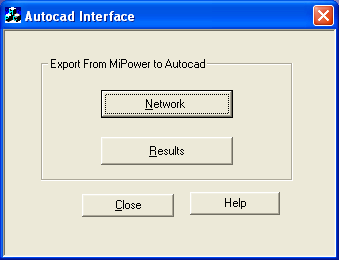
AutoCAD Interface is a utility to convert the MiPower® Network to AutoCAD and to plot the results obtained using the MiPower® applications on an existing AutoCAD diagram. By invoking Network option, conversion of MiPower® network to AutoCAD (.dxf file) file can be done. Results option helps the user to plot power system study results obtained from MiPower® on AutoCAD network (.dxf file) which is having the ZZcodes.
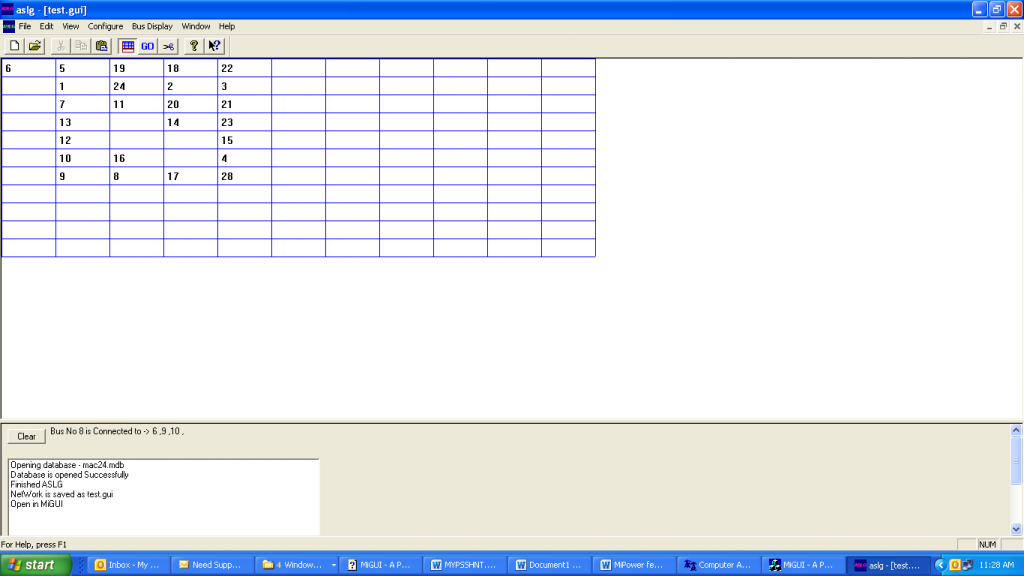
ASLG is a utility to generate the single line diagram of the electrical system. Input to ASLG is the MiPower database file for the particular electrical system.
- Quickly create networks after data entry.
- Realign buses based on user preference.
- View network in sections for better clarity.
- Saves time and effort in network creation.
- Easy-to-use and interactive tool.
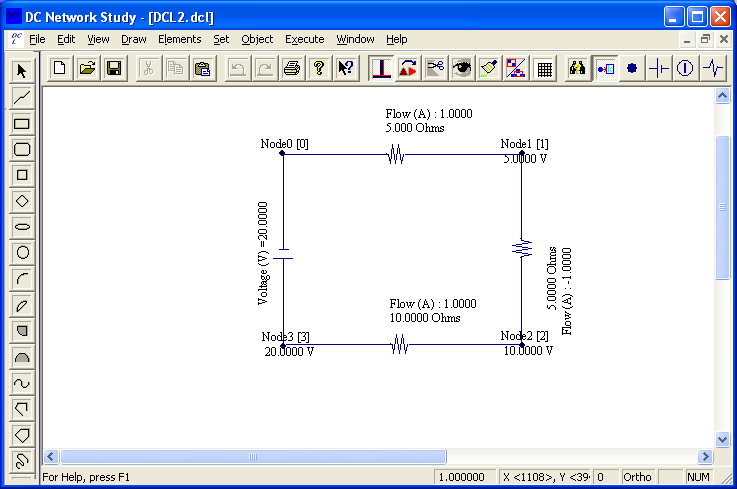
DC Network Solution is a module to analyze the DC networks. The output of the program is the currents flowing in the network and the voltages at the nodes, which is computed based on the network topology, the resistances of the branches and the source in the network.
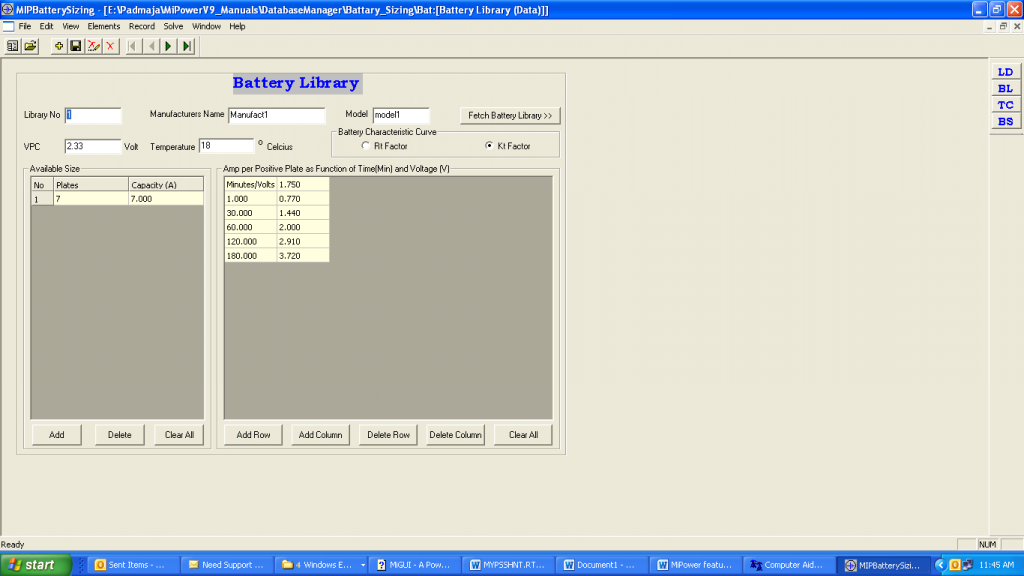
Battery sizing is a study function to determine the number of cells and cell size of the battery for a designated duty cycle. The number of cells is determined to satisfy the maximum system voltage during the battery charging period and minimum system voltage during battery discharging period. The number of cells/string is determined to provide sufficient power to the load cycle considering the minimum system voltage and minimum operating temperature. It also considered different factors that affect the battery performance, such as design margin, aging compensation, initial capacity, etc. It follows IEEE standard 485-1997.
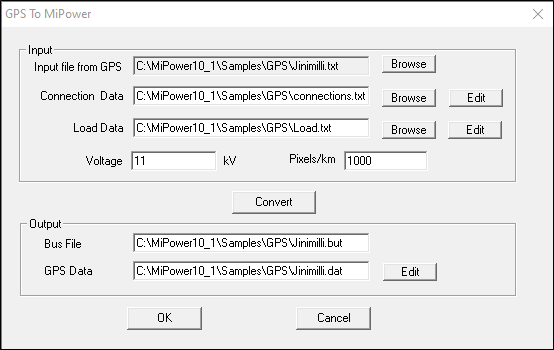
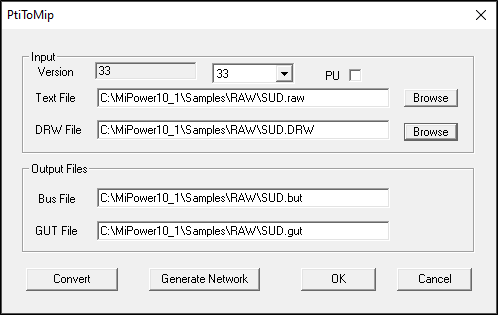
- Helps in creating a centralized database from standard text files (e.g., PSSE RAW, GPS text files).
- Delete network data as required.
- Helps in creating standard libraries and element files from the existing database.
GPS (Input files) to mdb File Conversion
PSSE RAW File Conversion
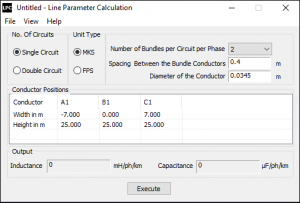
- Supports both MKS (Metric) and FPS (Imperial)
- Picks between single or double circuit line configurations.
- Customize conductor properties (bundling, spacing, diameter, position).
- Outputs include Inductance, Capacitance, GMD, GMRL, and GMRC.
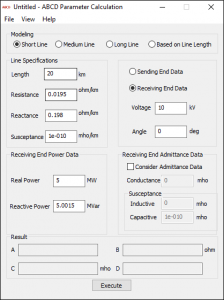
- Modeling lines as short, medium, or long based on length.
- Configurable Sending/Receiving end kV, δ, MW, MVAR and Receiving end admittance data.
- Outputs:
- ABCD constants.
- Line kV per km.
- View sending-end voltage and current phasors, along with MW and MVAR values.
- Display power factor, voltage regulation (%), and efficiency (%) for both sending and receiving ends.
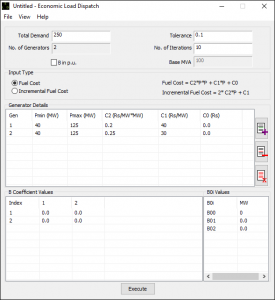
- Select cost function: normal or incremental fuel cost.
- Set total demand, number of generators, and convergence criteria for lambda-iteration method.
- Configure generator limits, cost data, and B-coefficient matrix.
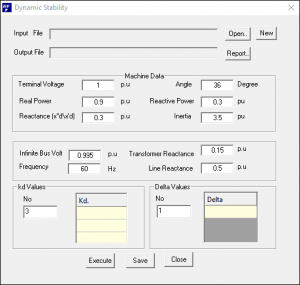
- Analyse dynamic stability with a two-machine system example.
- Customize Parameters (like machine data, infinite bus voltage, system frequency, transformer reactance and line reactance).
- Accepts Multiple input Kd and δ Values.
- Outputs dynamic coefficients and angular frequency.
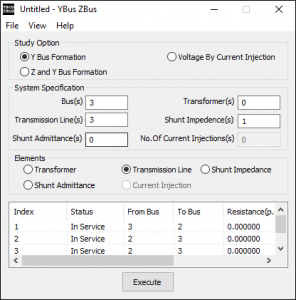
- Select study type: Y-Bus formation Y-Bus & Z-Bus formation, or Voltage by Current Injection.
- Provides fields to define full system specifications, including the number of elements and their details.
- Outputs Y-Bus, Z-Bus matrices and bus voltages (along with V ∠θ° for all buses).
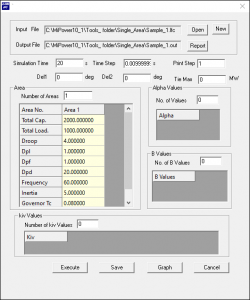
- Choose single or multi-area LFC (Load Frequency Controllers).
- Allows customization of simulation settings and area-specific details.
- Analyses how single-area frequency responds to demand changes, with or without load frequency controllers (LFCs).
- Analyses multi-area frequency and tie-line flow response when demand changes in one area.
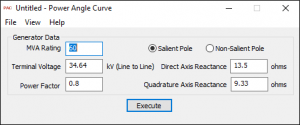
- Choose salient or non-salient pole machines.
- Configure generator rating, voltage, PF (Power Factor) and d-q axis reactance.
- Output results in machine power angles (δ) with corresponding electrical and reluctance power (MW).
- Includes an optional graph to visualize power vs. power angle for better understanding.
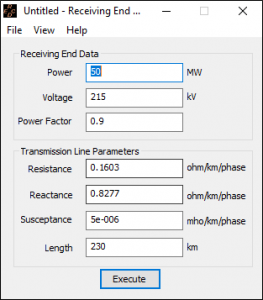
- Configure line impedance, length, receiving end power, PF (power factor), and voltage.
- Computes sending-end voltage, max real power, and power circle parameters.
- Includes power circle graph (MW vs. MVAR).
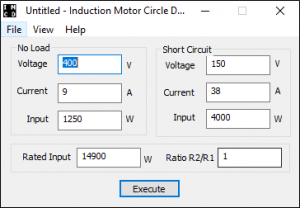
- Set voltage, current and input power values for no-load and short-circuit conditions.
- Calculates motor parameters based on rated input and stator/rotor resistance ratio.
- Shows full-load motor values, including maximum input power, output power, and torque.
- Provides a graph of the induction motor circle diagram (Real vs. Reactive power).
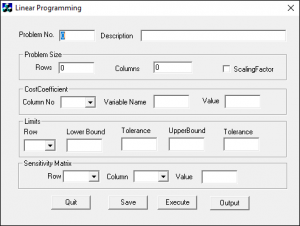
- Customize matrix size (rows and columns) and scaling factor.
- Define cost coefficient variables and their values for each column.
- Set upper and lower limits with tolerances for each row.
- Shows results including convergence status, objective function value, and linear programming solution.
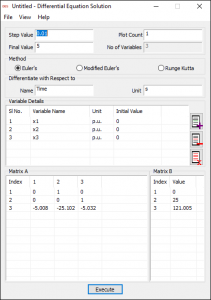
- Set the number of variables along with their units and initial values.
- Define coefficient matrices [A] and [B].
- Choose from solver methods like Euler’s, Modified Euler’s, or Runge-Kutta.
- Solves differential equations using the formula [x’] = [A] [x] + [B].
- Calculates values for each variable at every time step.
- Displays a graph showing variable values over time.
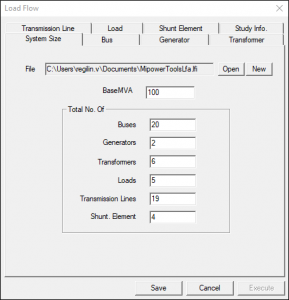
- Set basic system details including the number of elements and their specifications.
- Choose from various load flow methods like Gauss-Siedel (GS), Newton-Raphson (NR), or Fast Decoupled Load Flow (FDLF).
- Customize study parameters as needed.
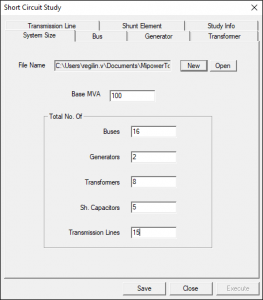
- Input basic system and fault data.
- Simulate different fault types (LLLG, LLG, LG and LL).
- Analyse faults at single/multiple buses with reactance (transient/sub-transient)
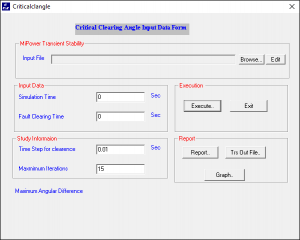
- Calculate critical clearing angle using TRS file inputs.
- Set fault clearing time, simulation times and study parameters.
- Generates a detailed report of the critical clearing angle, along with an output file for the MiPower TRS module and a graphical plot for easy analysis.
- Customize generator details such as power limits, cost coefficients, uptime/downtime, status, and start-up settings.
- Define hourly load inputs including power demand and reserve capacity.
- Select reserve type: Fixed, User Defined, or Percentage of Load.
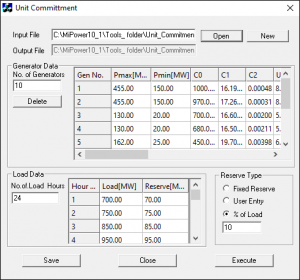
- Set the number of generators and load hours as needed.
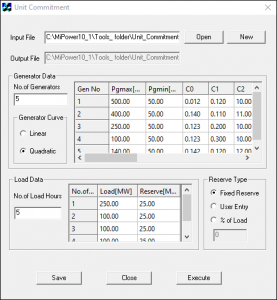
- Define generator details including power limits, cost coefficients, uptime/downtime, status, and start-up settings.
- Choose the generator cost curve type: Linear or Quadratic.
- Input hourly load data such as power demand and reserve capacity.
- Select the reserve type: Fixed, User Defined, or based on Percentage of Load.
Accordion Content
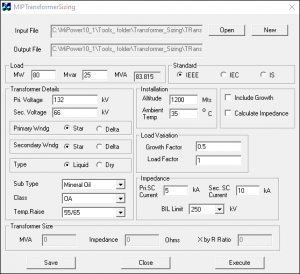
- Calculates transformer size based on its specifications and environmental conditions.
- Supports standard options: IEEE, IEC, and IS.
- Allows configuration of transformer details like HV/LV voltages, winding type, insulation (liquid/dry), cooling class, and temperature rise.
- Set installation altitude, ambient temperature, load info, and load variation factors.
- Configure HV/LV short circuit currents and Basic Insulation Level (BIL).
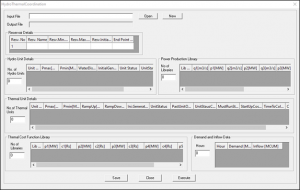
- Set reservoir details including storage limits and initial/final water levels.
- Configure hydro unit information such as unit count, power limits, output, and status.
- Use power production libraries with various volumetric flow rates and corresponding power outputs.
- Enter thermal unit details like power limits, ramp rates, initial generation, unit status, and starting parameters.
- Define thermal cost functions with multiple power outputs and corresponding costs.
- Input hourly demand and water inflow data.
- Economic Load Dispatch (ELD) for both hydro and thermal power plants.
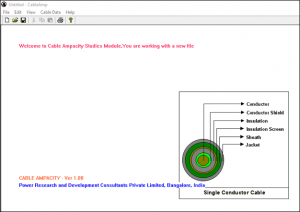
- Easy-to-use cable data editor with fully customizable input fields and settings.
- Supports both MKS (Metric) and FPS (Imperial) unit systems.
- Calculates cable ampacity based on user-defined ambient temperature (°C) limits and step size.
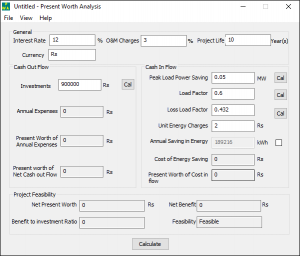
- Calculates project feasibility, net cash flow, and return on investment.
- Determines the payback period.
- Computes the project’s interest rate.
- Provides present worth results in a text format.
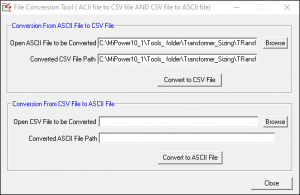
- Convert between ASCII (text) and CSV (Excel) formats for data handling.
