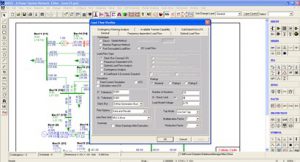
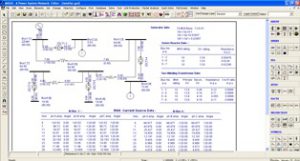
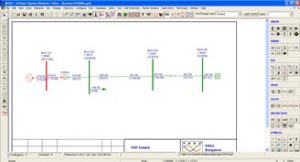
Load Flow Studies is basic tool for power system analysis to assess the steady state performance of power system under various operating conditions. This also enables studies pertaining to the changes in power system network configuration. It determines the power flows,complex bus voltagesand losses of the power system for a given load and generation profile. The challenges of modeling very largenumber of components are taken care of by exploiting Sparse techniques.
The key features of the module are :
- Gauss – Seidel (GS)
- Newton Raphson (NR)
- Fast Decoupled Load Flow (FDLF)
- Voltage & Frequency dependentLoads
- Multiple Island systems
- Customized Report
- Optimal Load Flow
- AC/DC power flow (HVDC)
- Modeling of FACTS devices
- Modeling ofRenewable Energy (RE) devices (Wind and Solar converters)
The output of the load flow studies is used by other system studies like short circuit, stability, motor starting, contingency analysis etc.
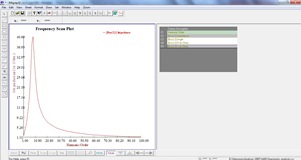
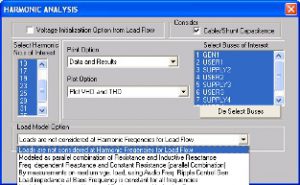
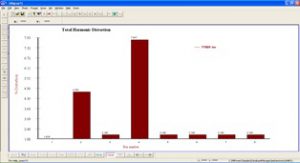
With the increasing proportion of harmonic currents in the power system, Harmonic Load Flow performs conduct the harmonic assessment to compute Total harmonic distortion factors for voltages and currents in three phase system. Harmonic load flow also computes harmonic transfer impedance and driving point impedance for both transmission and distribution power systems.
Harmonic analysis is done using Harmonic Load Flow and Frequency Scananalysis.
The key features of the module are :
- Computation of VTHD , ITHD , Telephone Interference Factor (TIF)
- Modeling harmonic voltage and current source
- Frequency Scan Analysis foruser-defined harmonic order
- Computation ofpositive, negative and zero sequence harmonics
- Transformer modeling with wide range of winding connections
- Graphical view for visualization of bus wise VTHD , ITHD and Frequency Scan
The output of the Harmonic Load Flow is useful in design of filters to reduce the harmonics.
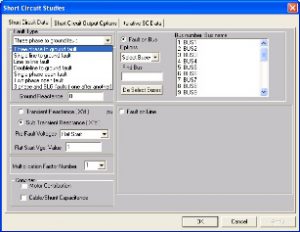
Short circuit studies are conducted to determine the fault currents and fault MVA levels in the power system. The various types of short circuit faults, at any location in the system, include
- Single line to ground(LG) fault
- Line to line (LL)fault
- Double line to ground (LLG) fault
- Three phase to ground fault (LLLG).
The key features of the module are :
- Symmetrical and Asymmetrical Faults
- Modeling of Self and Mutual Impedances
- Compliance to related ANSI/ IEEE/ IEC standards (including 363 & 909)
The selection of circuit breakers depends on the post-fault current (immediately after the fault) and the interruption current (which the breaker must interrupt). The results of the short circuit studies are often useful for determining the relay settings.
Power systems are often very big networks and have localized impact of disturbances. Network Reduction Module provides the static and dynamic equivalents for the power system. These are normally used for studying the impact of the faults and disturbances on the key components in the time domain simulations like transient and dynamic stability analysis.
The key features of the module are :
- Computation of Static and dynamic equivalents for the power system networks
- Computation of YBUS and ZBUS
- Static equivalent: YBUS basedreduction, seen from the desirednodes
- Dynamic equivalent: Single machine equivalent of the power system.
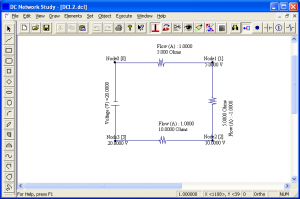
The DC Network Solution is a module to analyze the DC power networks.
The key features of the module are :
- D.C. Load Flow Analysis
- D.C. Short CircuitAnalysis
- Enables Battery Sizing
The DC network solution provides currents flowing through the branches in the network and the nodal voltages. The network topology, the resistances of the branches and the source in the network, source voltages and the loads are taken into consideration.
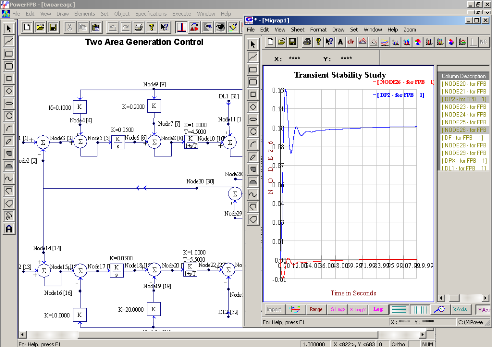
With the disturbances being the integral part of the power systems, it is vital for the system operator to understand the impact of these disturbances, from stability perspective, on the operational performance of the critical infrastructure like generators. The accurate transient response is critical for evaluation of the stability under large disturbances like faults.
The key features of the module are :
- Supports LG/LL/LLG/LLL/ LLLG fault at user defined location
- Detailed representation of
- Turbines governors and Excitation systems (AVR)
- Power System Stabilizers (PSS)
- Static VAr compensators (SVC), HVDC controllers
- Load Shedding as disturbance
- Simulation of voltage / current / frequency and distance relays
- Large Motor Starting Analysis
The studies enable the assessment of variations in operational parameters like Voltage, Current, generator frequency and rotor angle against limits. Remedial actions are planned accordingly.
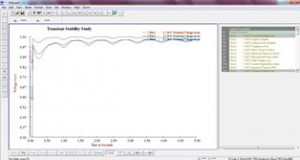
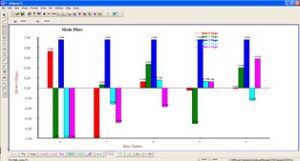
uration Machine voltage plots
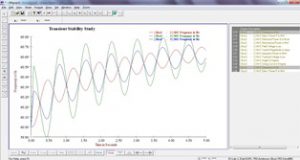
yCurves
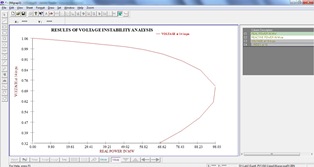
With the exploitation of the network to it’s maximum due to resource constraints, the computation of the risk of voltage instability gaining importance. Voltage Instability analysis assess the proximity to the critical point (Loadability limit) and also computes the margin, under steady state conditions. The ranking of the load buses based on the L-index value indicate the weak buses in the system and the largest L-index value indicates the proximity to the system collapse point.
The key features of the module are :
- Voltage instability assessment using L-Index and Centroid Voltage methodologies
- Stability margin computation under steady state condition
- Identify weak buses and areas in the system from Voltage Instability perspective
PV and QV curves are plotted for better visualization.
stability Analysis
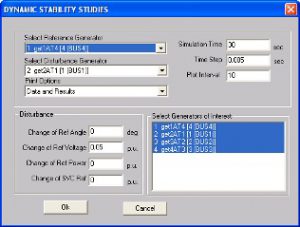
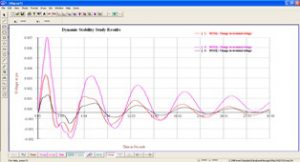
Dynamic stability indicates the ability of synchronous generators to adjust to small changes in load. The moving generators oscillate due to load change and normally settle to new values. It is important to analysis the generation oscillations and power swing oscillations to understand the small signal or dynamic stability. The amplitude and frequency of oscillations depend on the operating condition and inertia of the system.
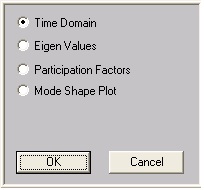
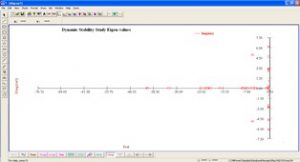
The dynamic stability analysis is carried out in Frequency domain (Eigen value analysis) and Time domain with slow disturbances.
The key features of the module are :
- Identification of the mode of oscillation
- Examine the most effective control location
- Adjustment in control parameters to improve system damping
- Simulate disturbances to understand potential risk of oscillatory instability
configuration
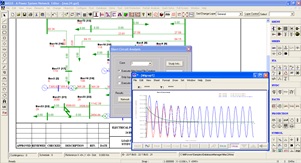
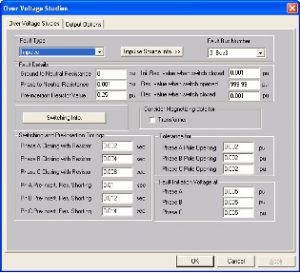
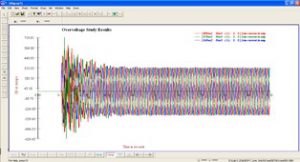
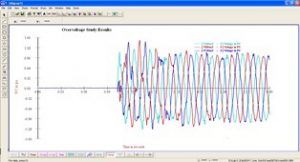
Overvoltage’s stress the insulation of the equipment and often lead to equipment failure. ETA module is designed to perform the transient and dynamic overvoltage studies for the power system arising out of switching operations, faults and lightning surges.
The key features of the module are :
- Computation of highest discharge currents and energy stresses for the protective equipment
- Assessment of withstand levels of currents and voltages for protected equipment
- Supports energization of lines, transformers and shunt elements
- Computes Over voltages during fault inceptions and clearing of faults
The simulation is useful for appropriate insulation co-ordination, and design of protection schemes. Simulation studies also facilitate investigation of interference due to communication lines, hazardous coupling effect to personnel, livestock, and equipment.
![]()
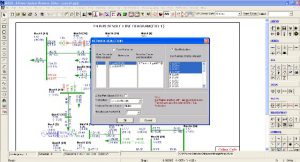
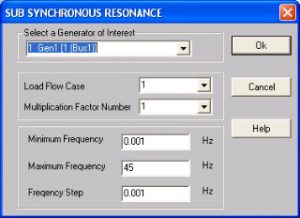
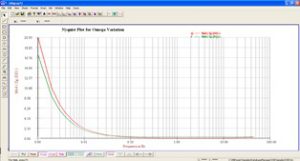
Series capacitors are often used in long transmission lines, at appropriate locations, to enhance the line loadability. Sometimes these series capacitors excite low frequency oscillations due to Sub Synchronous Resonance (SSR), and damage turbine-generator shafts.
Sub Synchronous Resonance computes the oscillations in current, voltage and generator torque at Sub Synchronous frequencies. The Nyquist plot enables the interaction between the designated generators and the network under consideration and defines the stability of the power system.
The key features of the module are :
- Frequency response method
- Multiple synchronous machines
- Series compensation in transmission network
- Detailed modeling of machine shafts and control loops
- Mode shape computation for SSR/Stability evaluation
ASSESSMENT & CONTROL
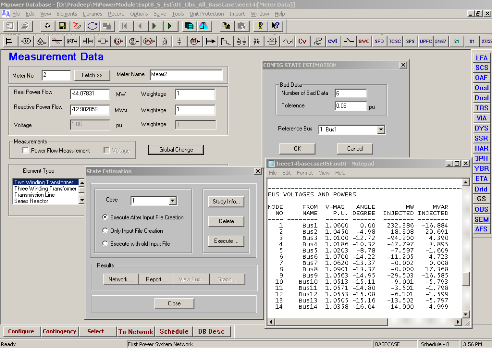
State estimation deals with the real-time measurements to obtain the best estimate of the current state of the power system, based on the network connectivity, system parameters and the analog measurement as inputs. With the error minimization algorithm, state estimation algorithm provides consistent base case, used for further power system analysis.
Adequacy of the measurements is assured by observability analysis, required for successful run the state estimation.
The key features of the module are :
- Standard Weighted Least Square (WLS) method
- Bad data identification and suppression
- Observability Analysis for RTU Locations
The output of the State estimation is estimated load, generation and voltage profile along with the real and reactive power flows. This is used for carrying out power system simulation like, load flow scenarios, real and reactive power optimization and security analysis.
The optimum utilization of power system resources is always the highest priority of the system operators. The Optimal Power Flow(OPF) provides the optimum unit generation with the minimum overall cost of generation, while satisfying the transmission system constraints. The OPF is used in economic analyses of the power system by providing “bus incremental costs” (BICs). The BICs are useful to determine the marginal cost of power at any bus in the system.
Optimal power flow also computes the incremental or marginal cost of power transmitted/ traded between multiple power companies while satisfying the security constraints on to the internal networks as well as tie lines.
The following objectives can be set for the OPF :
- Generation cost minimization
- System loss minimization
- Overload alleviation
The enables the system planners and operators with the optimum solutions expediting the decision making.
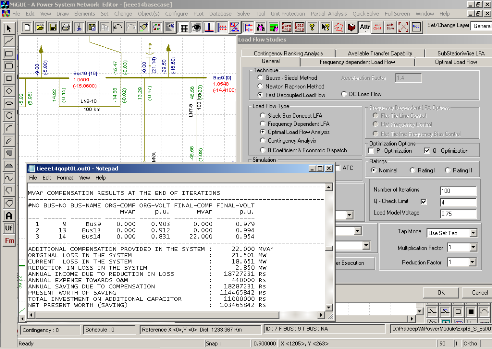
To optimize the reactive power resources, Reactive Power Optimization module is aimed at improving the voltage profile of low voltage pockets in the system.
The objectives for the reactive power optimization are :
- Alleviation of the system bus voltages
- Enhance voltage stability or loadability
Using the control variables are :
- The transformer tap settings (T)
- The generator excitation settings (V)
- The switchable and controllable VAR compensator
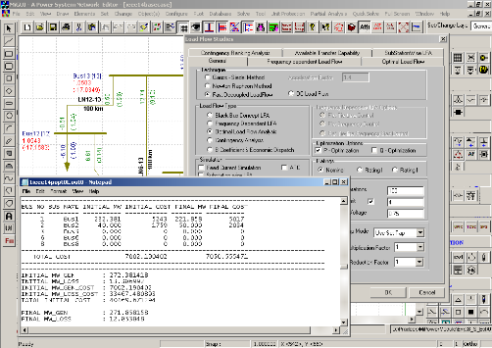
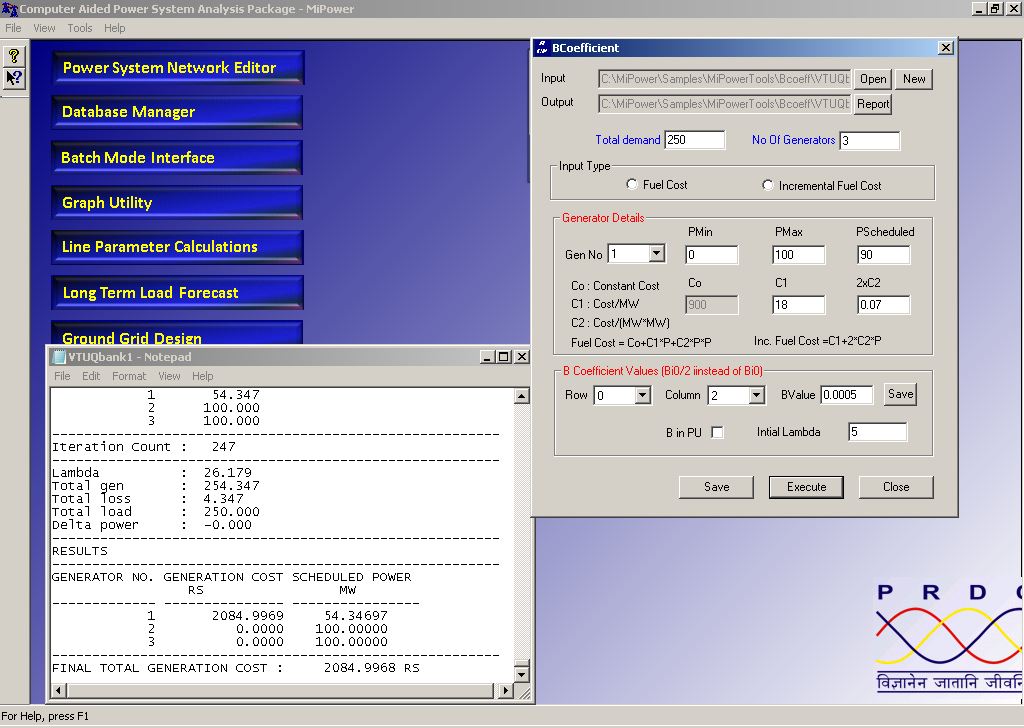
In operating the system for any load condition, the contribution from each plant and from each unit within a plant must be determined so that the cost of delivered power is minimum. The methodology used during economic scheduling is to minimize the total cost (generation + loss) with the generation schedule being considered within specified minimum and maximum generating limits.
Economic operation of power system deals with sharing the total load to minimize the overall generation cost. It also includes dividing the generations optimally to reduce losses in the system.
The output of the program gives the schedule of the generators and the overall cost.
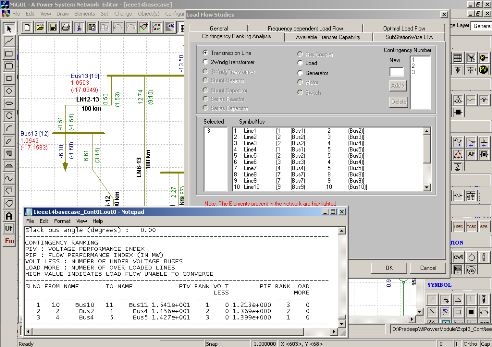
Load flow analysis performs static security analysis for a given system so that the system is operated defensively. Due to contingencies, the system operations may enter into emergency state, wherein the operator has to take fast actions to restore the system back to normal.
Contingency definition accommodates all types of equipment outages and also the combination of them. The outage scenarios are studied using robust load flow analysis.
The contingencies are ranked based on :
- voltage performance index (PIV)
- overload performance index (PIF)
The worst case scenario will be top ranked having highest number of voltage and line loading violations.
The output of the contingency analysis is used for security assessment and enhancement.
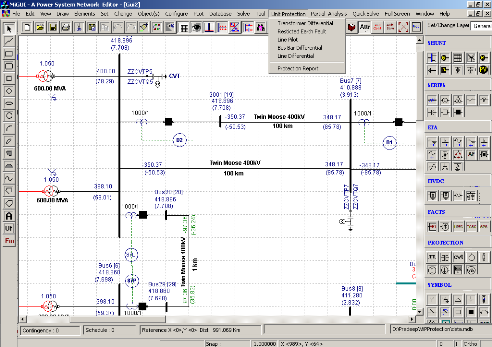
Power system protection study deals with precautionary measures to be taken to safeguard the power system during abnormal operating conditions which involves periodic fault studies followed by relay setting, checking and coordination studies. Power System Protection can be current graded or time graded or a combination of both. The equipments in a power system need to be protected against faults which are external or internal faults. The schemes are broadly classified as unit protection schemes and graded (Time/Current) protection schemes.
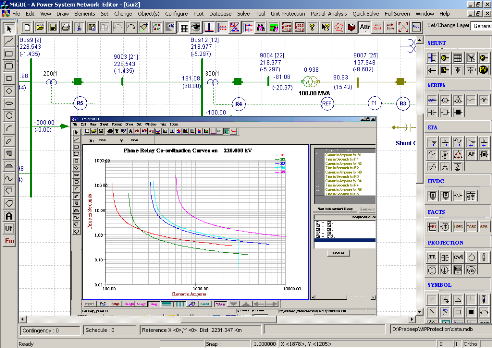
Over current relay coordination studies provide Plug and time settings for appropriate functioning of protective relays with proper discrimination. This assures required reliability, sensitivity and selectivity of power system equipment.
The over current relay coordination study gives :
- Plug Settings – for the phase/ earth relays
- Time dial settings – for the phase/ earth relays
- Instantaneous setting – for the phase/ earth relays
- Primary and Backup Pairs
The output of the module provides the coordinated settings of the relays. These can be viewed in the form of graphs and reports. User defined settings also can be verified for the system. The co-ordination curves can be viewed and checked for the proper coordination.
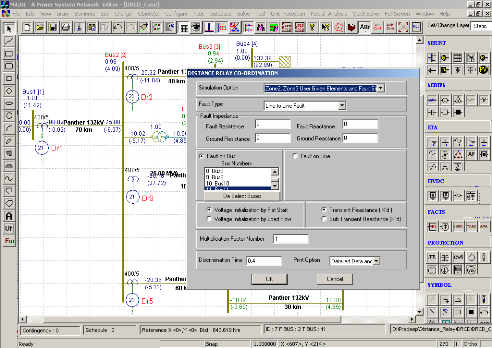
The distance protection is the most widely spread protection in transmission and sub-transmission networks. Distance relay responds to the ratio of measured voltage and current and operates if measured impedance (V/I) is less than the threshold value. Typically, distance relays are provided with multiple zones of protection to meet the stringent selectivity and sensitivity norms.
The key features of the distance relay coordination algorithm are :
- Phase loop and earth loop impedance settings as per relay make and model
- Load encroachment settings
- Power Swing Blocking settings
- Arc and Tower footing resistance
- Impedance seen by relays for given fault location and type
The simulation output is also used for validation of user-defined settings.
Unit protection schemes are used for protecting components like transmissions, transformers, bus bars, generators etc or a zone/sub-system. It does not involve time grading and relatively faster in operation. Unit protection is usually achieved by means of comparison of quantities at the boundaries of the zone.
Unit protection algorithms provide the settings for the relays used in :
- Transformer Differential Protection scheme
- Line Differential Protection scheme
- Bus bar Differential Protection scheme
- Partial Bus bar Differential Protection scheme
- Generator Protection scheme
- Restricted Earth Fault
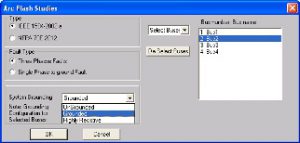
Safety being the key concern, Arc Flash Analysis provides limiting values of arcing current and incident energy to define the safe boundaries for the working personnel in the electrical installations.
The analysis determines the following :
- Arcing current
- Incident energy
- Hazard Risk Category (HRC)
- Personal Protective Equipment (PPE) requirements in an electrical system
The following standards are referred to compute safety requirements :
- IEEE 1584-2002a
- NFPA 70E 2012
The output of the Arc Flash Analysis provides the safety label which showcases the necessary information/ warning details for the safe working distance and the PPEs to be used.

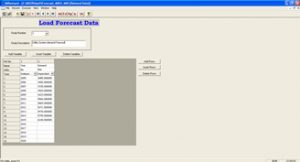
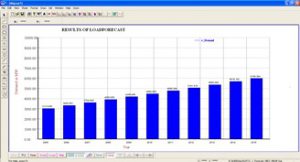
Load forecast is used to predict the energy demand during the planning stages of a power system. The robust multivariate regression technique is used for forecasting the energy demand accurately. The models are built based on the historical data.
The salient features of load forecast are :
- Versatile load models
- Best model selection for regression analysis
The output of the load forecast is used as an input to following studies.
- Generation and transmission capital investment
- Spinning reserve planning
- Planning of fuel ordering
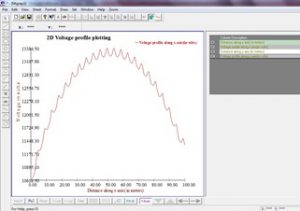
This module is designed to compute the substation ground grid. The program conforms to ANSI and IEEE Guide for Safety (80-2000) in AC Substation Grounding. Ground Grid Design(GGD) module has been built, especially for utilities and industries, to design an economic and safe grounding grids. The tool is also used for checking adequacy of existing grounding grids for possible reinforcement. The GGD has efficient and well-proven analysis algorithms, User-friendly data entry and graphical 2-D plotting.
The key features of the module are :
- Economic Design of EHV Grounding Grids
- Use of standard ANSI/IEEE 80-1986/2000 Methodologies
- IEC TS 60479 Compliant
- IS 3043-1986 Compliant
- 2-D Potential profile plotting
The output of the tool helps in analyzing earth potentials and enables engineers to choose a technically sound and economical design of grounding grid from a variety of options.
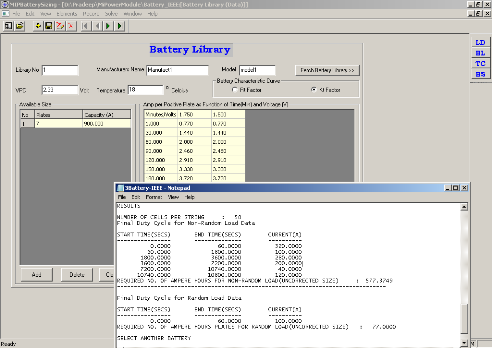
Battery sizing is a tool to determine the number of cells and cell size of the battery for a designated duty cycle such that it satisfies the maximum system voltage during the battery charging period and minimum system voltage during battery discharging period. The number of cells/string is determined to provide sufficient power to the load cycle considering the minimum system voltage and minimum operating temperature. It also considers different factors that affect the battery performance, such as design margin, aging compensation, initial capacity, etc.
The key features of the module are :
- IEEE Standard 485-1997 compliant.
- Computes number of cells and size for designated duty cycle
- Handles voltage and temperature constraints
- Battery performance assessment for design margin and aging compensation.
The output of the battery sizing program provides the size of the battery for a given load pattern.
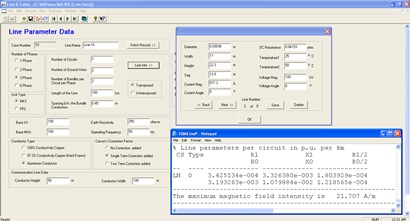
Line and Cable parameter program computes overhead transmission line and cable parameters from the design data. Overhead transmission line is represented by an equivalent “Pi” model, having resistance and reactance in series and line charging susceptance equally divided at either node as shunt element.
Key features of line parameter program are :
- Calculates positive and zero sequence parameters of the overhead lines and cables
- Single and multi phase configurations with ground wires
- Calculates the mutual impedance between power and communication lines
- Skin effect is considered for transmission lines
The output of the program is used as input data for the modeling of the lines/ cables for system studies.
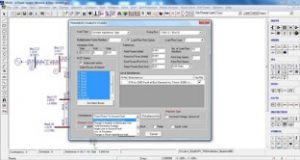
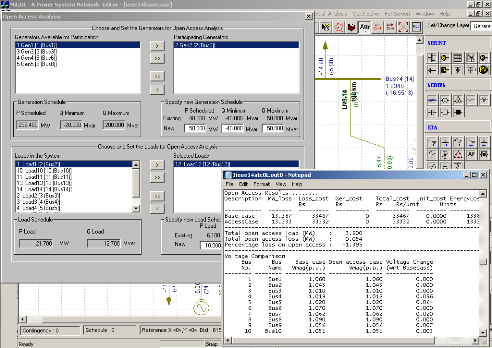
Available Transfer Capability program computes the measure of the transfer capability and available margin in the transmission network and suggests the system operations with various schedules of generators and loads participating in bilateral transactions to maintain an efficient, coordinated and economical distribution.
The key features of the module are :
- Full AC power flow solution – accurately determines real and reactive power flows, bus voltages
- An efficient Repeated Power Flow (RPF) is used for processing the large number of scenarios/ contingencies to assess ATC for each transfer capacity evaluation
The output of the tool is used by the utility to determine the available transfer capacity in the transmission network.
![]()
f the Open Access Feasibility are :
- Facility to model generators and loads entering into bilateral transactions
- Utilizes the network for low cost generation
- Determines the OAF for the given network for given load/generation profile
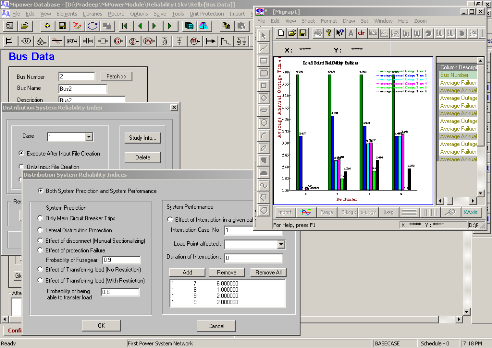
With the electricity consumers having right to get reliable and quality supplies, gaging such indices is important for distribution utilities. Reliability assessment tool computes such standard reliability indices which include SAIDI, CAIDI, SAIFI and CAIFI. These indices gage the performance and quality, and compared with the standard requirements.
The key features of the module are :
- Computation of reliability indices like SAIDI,SAIFI,CAIDI, CAIFI
- Report option with and without exclusions
- Detailed report of reliability assessment
- Graphical representation of the reliability indices
The output indices mainly represent the outage duration, outage frequency and number of consumers affected.
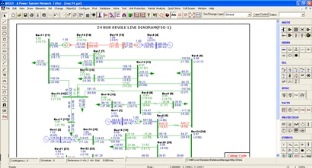
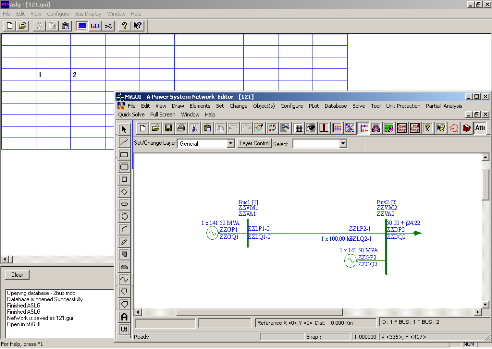
Automatic Single Line diagram Generation is an utility to generate the single line diagram of the electrical system. Input to ASLG is the MiPower® database file for the particular electrical system.
The key features of the module are :
- Creates a single line diagram automatically for full or partial network.
- Captures input directly from database
A generalized modeling method for various system components in control system dynamic simulation is implemented in transient stability program. The program can accommodate models of varied degrees of complexity. The various components of control block is described to software by using elementary functions such as integrator, adder, multiplier, switch and simple non-linear functions.
The key features of the module are :
- General purpose modeling tool for control blocks
- Time domain response analysis
- Customized design for generator AVR, governor, SVC, HVDC etc…
- Compatible with Transient stability analysis module
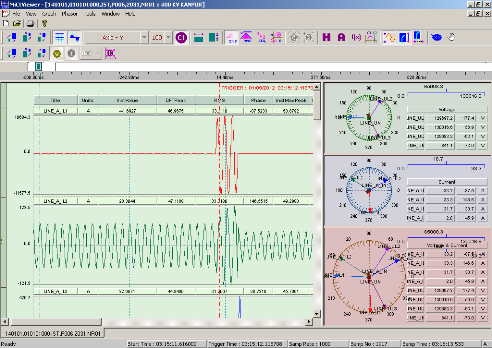
COMTRADE Viewer module is provided for the user to view the COMTRADE files both in numerical and graphical way. The COMTRADE viewer reads the .DAT file and .CFG file for the inputs and it displays the samples both in numerical as well as graphical format. The data display offers a high-resolution graphical interface for displaying, analyzing and manipulating analog and digital channels of an oscillography record or a periodic load file. Displayed channels are marked, zoomed, numerically processed and summarized.
The key features of the module are :
- Graphical view of the COMTRADE files
- Mathematical analysis and operations on data
- High resolution graphical interface for clear display and analysis
- Handles analog and digital channels of an oscillography record
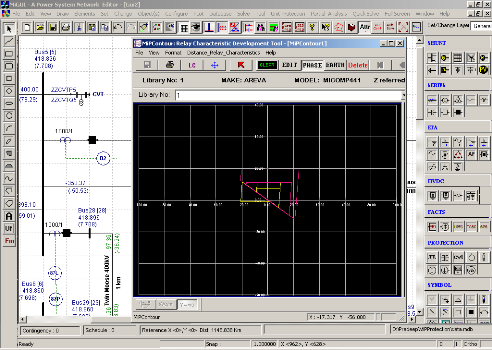
MiPContour is a graphical tool which is used to draw a distance relay characteristics library. This tool is used to create a relay characteristics library as per the relay settings.
The key features of the module are :
- Build a user defined distance relay characteristics for variety of relay characteristics
- Supports all Vendor specific data format
- Modifying relay characteristic to match particular scenario
- Allowing to develop user defined characteristics
- Accurate visualization of the relay characteristics on one platform
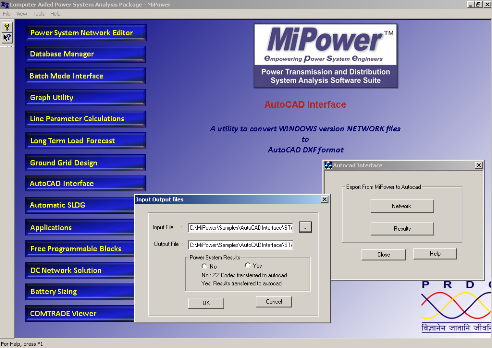
AutoCAD Interface is a utility to convert the MiPower® Network to AutoCAD and to plot the results obtained using the MiPower® applications on an existing AutoCAD diagram. By invoking Network option, conversion of MiPower network to AutoCAD (.dxf file) file can be done. Results option helps the user to plot power system study results obtained from MiPower on AutoCAD network (.dxf file).
The key features of the module are :
- Converts MiPower network diagram to AutoCAD
- Facilitates the plots of results from MiPower® applications on
- AutoCAD
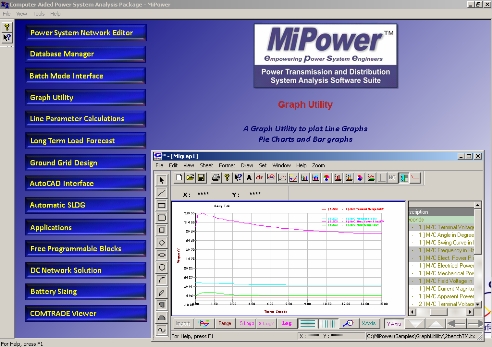
Graph utility is a module of MiPower® to view the results of MiPower® applications in linear, semilog and logs scale. The input to this module is the binary file/s generated from MiPower® applications. The selected graph from the binary file can be stored as graph files “grp”. Here window is split into two panes. In the first pane, the graph is plotted and the second pane contains a list having all the variables extracted from the binary file. X and Y-axis variables has to be selected from the list to plot the graph.
The key features of the module are :
- Multiply X and Y column in same view
- Quick mathematical operations on graphs
- Custom color, thickness, symbols, fonts, number of symbols on curve etc…
- Graphical relay coordination
- Export graph DXF, data to text format