Automatic Single Line diagram Generation is an utility to generate the single line diagram of the electrical system. Input to ASLG is the MiPower® database file for the particular electrical system.
The key features of the module are :
- Creates a single line diagram automatically for full or partial network.
- Captures input directly from database
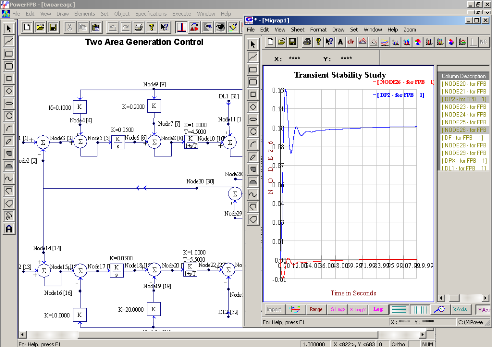
A generalized modeling method for various system components in control system dynamic simulation is implemented in transient stability program. The program can accommodate models of varied degrees of complexity. The various components of control block is described to software by using elementary functions such as integrator, adder, multiplier, switch and simple non-linear functions.
The key features of the module are :
- General purpose modeling tool for control blocks
- Time domain response analysis
- Customized design for generator AVR, governor, SVC, HVDC etc…
- Compatible with Transient stability analysis module
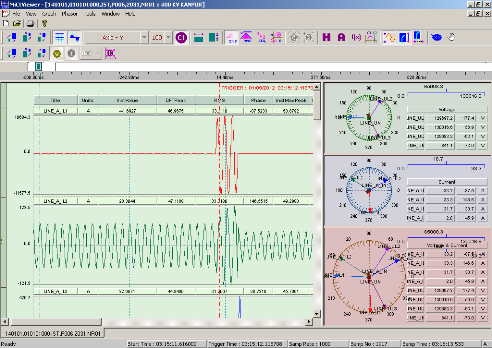
COMTRADE Viewer module is provided for the user to view the COMTRADE files both in numerical and graphical way. The COMTRADE viewer reads the .DAT file and .CFG file for the inputs and it displays the samples both in numerical as well as graphical format. The data display offers a high-resolution graphical interface for displaying, analyzing and manipulating analog and digital channels of an oscillography record or a periodic load file. Displayed channels are marked, zoomed, numerically processed and summarized.
The key features of the module are :
- Graphical view of the COMTRADE files
- Mathematical analysis and operations on data
- High resolution graphical interface for clear display and analysis
- Handles analog and digital channels of an oscillography record
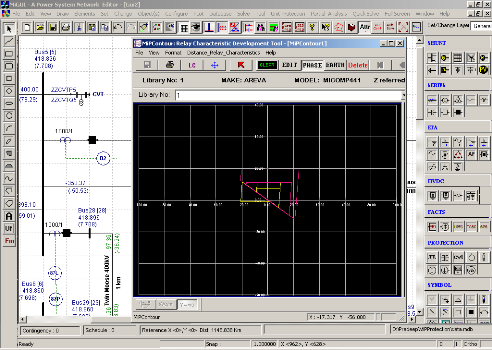
MiPContour is a graphical tool which is used to draw a distance relay characteristics library. This tool is used to create a relay characteristics library as per the relay settings.
The key features of the module are :
- Build a user defined distance relay characteristics for variety of relay characteristics
- Supports all Vendor specific data format
- Modifying relay characteristic to match particular scenario
- Allowing to develop user defined characteristics
- Accurate visualization of the relay characteristics on one platform
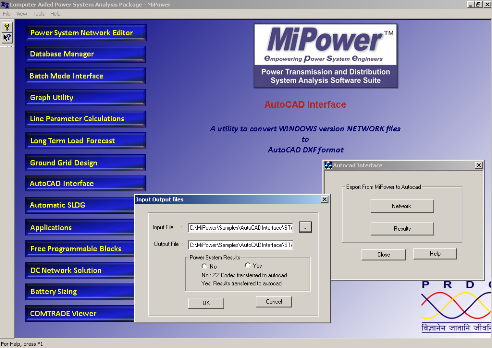
AutoCAD Interface is a utility to convert the MiPower® Network to AutoCAD and to plot the results obtained using the MiPower® applications on an existing AutoCAD diagram. By invoking Network option, conversion of MiPower network to AutoCAD (.dxf file) file can be done. Results option helps the user to plot power system study results obtained from MiPower on AutoCAD network (.dxf file).
The key features of the module are :
- Converts MiPower network diagram to AutoCAD
- Facilitates the plots of results from MiPower® applications on
- AutoCAD
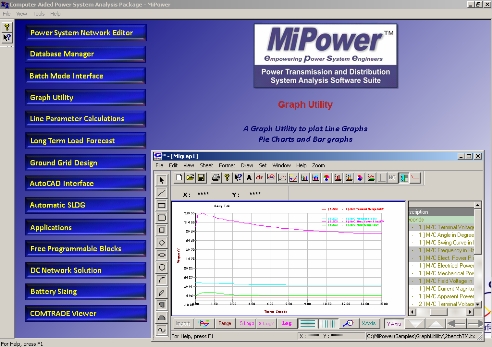
Graph utility is a module of MiPower® to view the results of MiPower® applications in linear, semilog and logs scale. The input to this module is the binary file/s generated from MiPower® applications. The selected graph from the binary file can be stored as graph files “grp”. Here window is split into two panes. In the first pane, the graph is plotted and the second pane contains a list having all the variables extracted from the binary file. X and Y-axis variables has to be selected from the list to plot the graph.
The key features of the module are :
- Multiply X and Y column in same view
- Quick mathematical operations on graphs
- Custom color, thickness, symbols, fonts, number of symbols on curve etc…
- Graphical relay coordination
- Export graph DXF, data to text format