Key Features
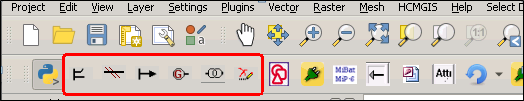
The MiPower-QGIS integration includes several custom plugins that let users access MiPower’s core functions directly from the QGIS interface.
Key plugins include:-
Create Database from Shape files
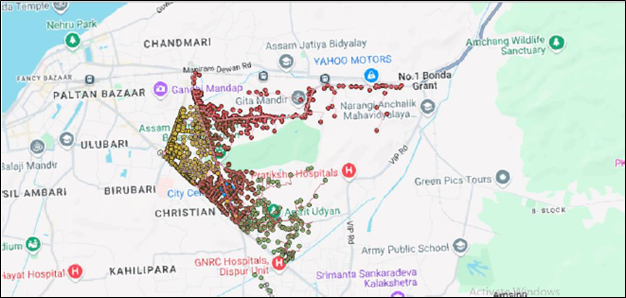
Easily build MiPower-compatible databases from shape files representing geographic regions. Import key power system components such as:- Poles: Shape files showing the location and details of poles.
- Transmission Lines: Shape files with data on power lines connecting different nodes of the system.
- Loads: Represents Power consumption points, such as homes, businesses, or industrial zones.
- Transformers: Shape files displaying the position and specifications of transformers within the power system.
The plugin extracts relevant data from each shape file and converts it into a format suitable for functional MiPower database. Once the database is created, you can use MiPower’s Solve Menu to run various studies.
-
Solve Menu Plugin
Run MiPower study modules directly within the QGIS interface for a faster, more efficient workflow. By combining MiPower’s advanced analysis tools with QGIS’s geospatial platform, users can perform power system studies on location-based data – without needing to switch between applications.
Available study modules include:- Load Flow Analysis: Analyse power flow across the network using Geographical data.
- Short Circuit Analysis: Analyse how fault conditions affect the system using data from shape files.
- Stability Studies: Evaluate system stability under dynamic conditions like faults and load changes.
-
Tooltip Feature Plugin
The Tooltip Feature Plugin improves user experience by showing study results directly on the QGIS map. This feature lets users quickly see important information without opening result files. After running power system studies like load flow or short circuit analysis, users can hover over network elements—such as poles, lines, loads, or generators—to instantly see key results like voltage, power flow, or fault current. This feature makes it easy to check system performance without leaving the map.
-
Add/Delete Feature Plugin
Use the Add/Delete Plugin to update the MiPower database directly from QGIS. Manage system components in real time:
- Add Elements: Such as Poles, lines, loads, and generators – directly in QGIS. The plugin then updates the MiPower database automatically to reflect the changes.
- Delete Elements: The plugin uses the MiPower Database Manager to process the deletion and sync the updates with the MiPower system.